Welcome to learn how to use Carbon Tree and find some interesting links related to global carbon balance!
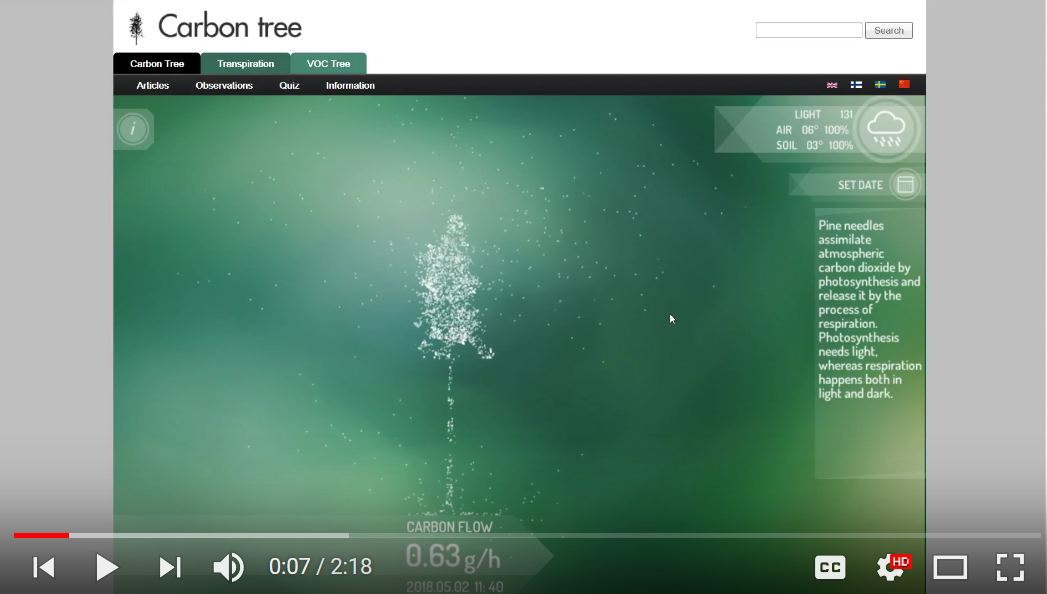
Carbon Tree is based on measurements executed at the Hyytiälä Forestry Field Station since 2008. At the homepage you can see how our special Scots Pine tree is fixing carbon at the SMEAR II measurement station. Watch the learning videos via following links and see how the interactive animation works.
Carbon flow video demonstrates how you can examine the components of carbon flow.
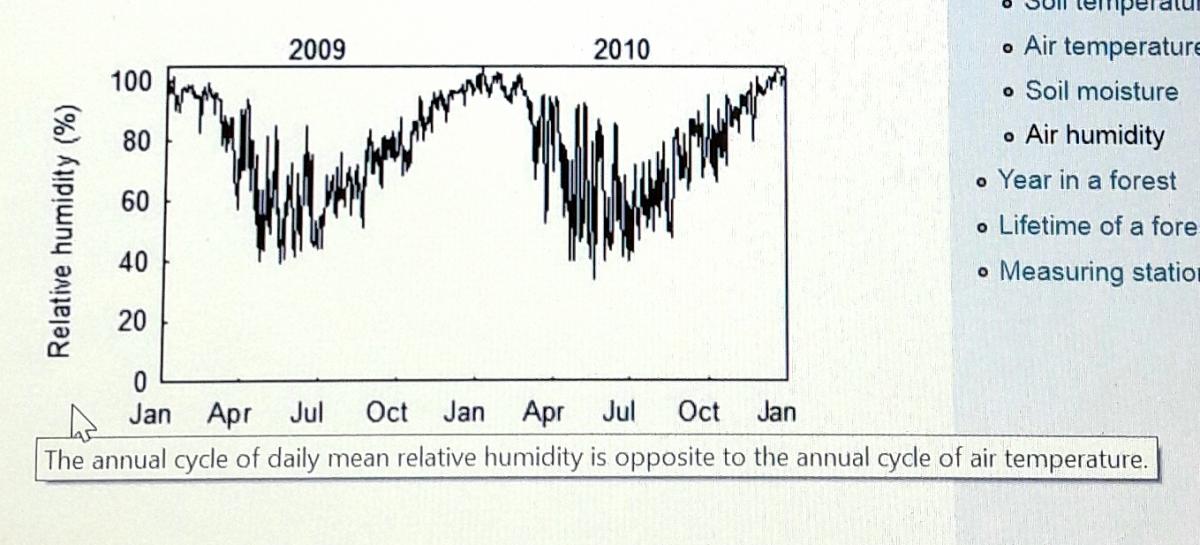
Weather conditions video shows you how to study the effects of environmental conditions on the carbon flow of a Scots Pine.
Observations video familiarizes you with the tools for viewing the past observations of carbon flow and weather conditions.
At the website, you will find also an other animation called Transpiration. With this animation, you are able to focus more closely on functions of a plant leaf, and adjust the abiotic environmental factors to see how the leaf reacts to them. You can do the adjustments with sliders locating under the animation. If you can’t see these sliders on the bottom of the page, zoom out the page until you see them. The keyboard shortcuts for zooming out are:
Windows and Linux: Press Ctrl ja -.
Mac: Press ⌘ ja -
You will find more precise information about the figures by hovering cursor over the picture as shown in the figure to the right.
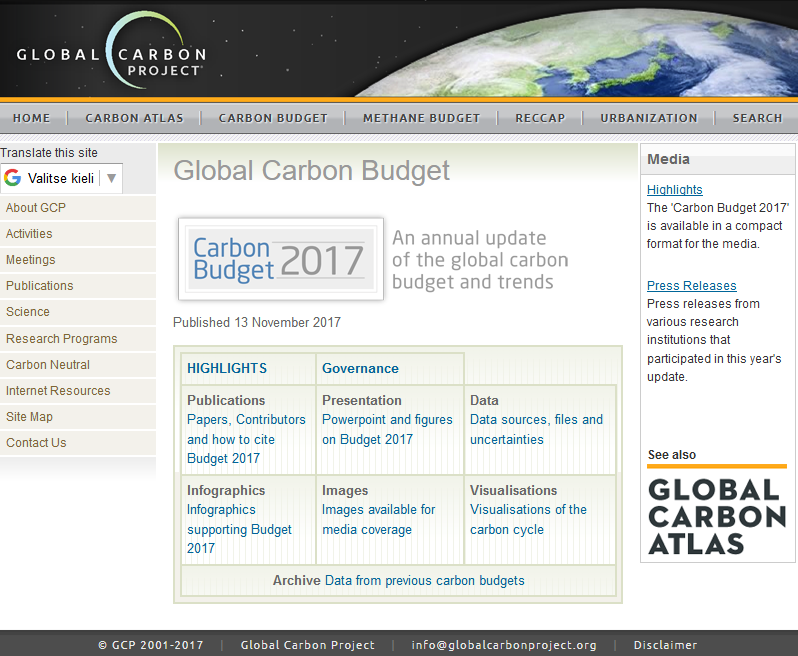
Global Carbon Project (GCP) releases every year an update of the global carbon budget and trends.
You can find out e.g. how carbon dioxide emissions and atmospheric concentrations have developed in last year compared to previous years, which are the contributions of different countries and how natural phenomena affect the annual carbon budget.
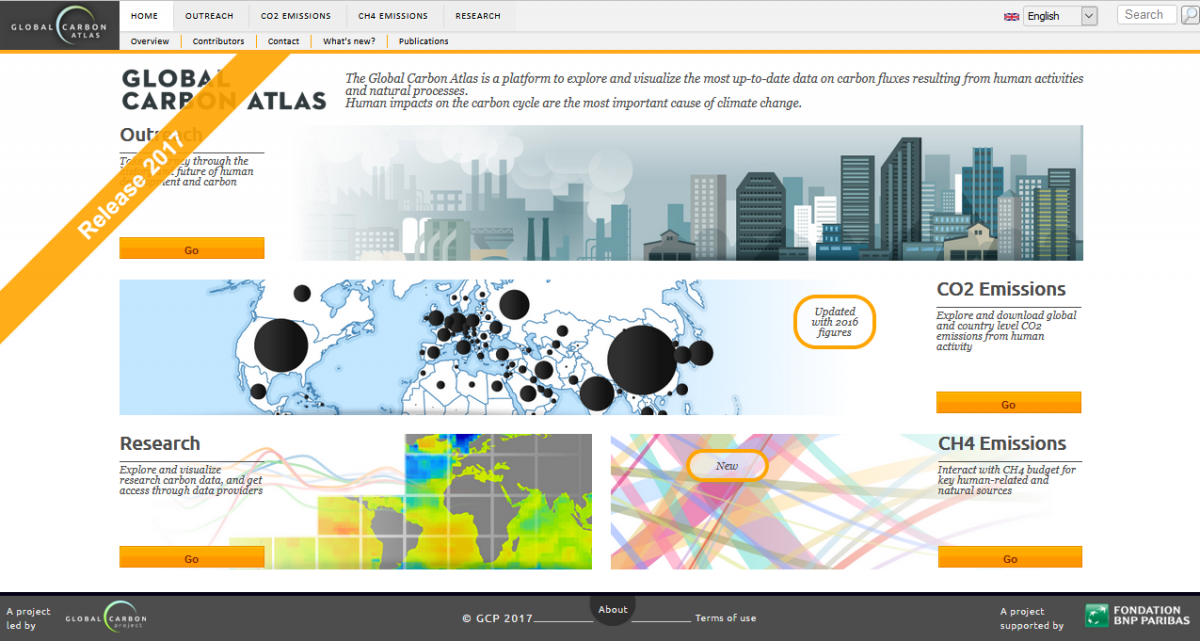
GCP also maintains Global Carbon Atlas, which is a platform to explore and visualize carbon fluxes from different sources.