Many years of measurements have provided a lot of information on the behaviour of the forest, how it photosynthesizes, transpires and respires. We know more or less what to expect the tree will do according to the time of the year, the availability of light, the air and soil temperature and the water availability in the soil. We can express this knowledge as mathematical models that can forecast the overall behaviour of the tree. Mathematical modelling is a typical tool to describe the phenomena in an exact and concise format. However, always bear in mind that the model reflects only such variables in reality which exist in the model.
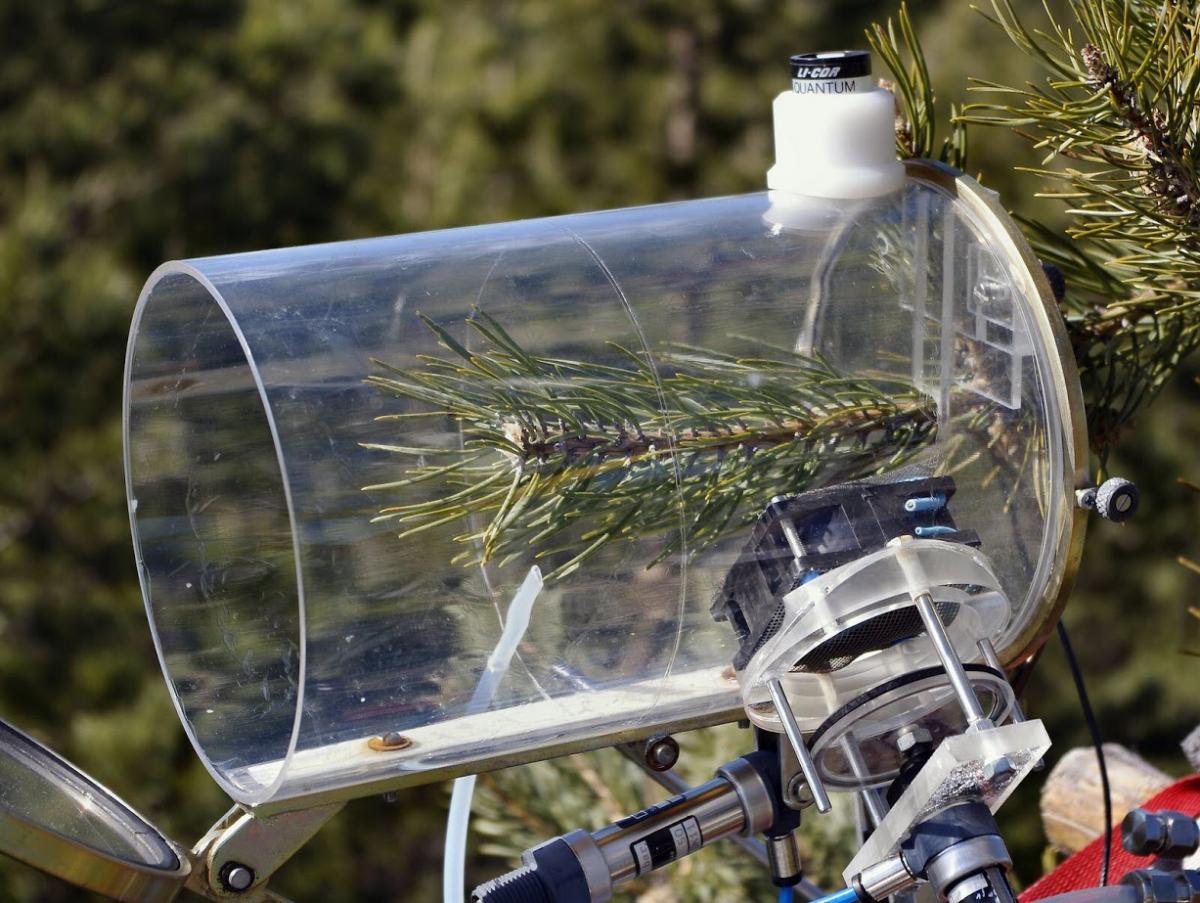
The animated photosynthesis is the result of one such model. According to real weather and soil conditions measured on-line at Hyytiälä, we use a fairly straightforward and simplified mathematical model to calculate the photosynthesis rate. The model includes the most common environmental responses, while it omits the change in the internal state of the plant, for the most part. This means that the responses presented here, are not necessarily the same throughout the year but changing a little over time.
To calculate photosynthesis, we use a multiplicative expression of the functions for the main controlling factors. This is expressed mathematically as:
P = f(LAI) • f(PAR) • Min{f(VPD),f(REW)} • f(T) • f(Tmin) • f(S) • f(CO2).
P stands for photosynthesis, or rather, the flux of carbon created by photosynthesis and f() stands for function of and describes the individual effect of every factor on the photosynthesis.
In this expression, the maximal photosynthesis at each moment is determined by the leaf area (LAI), light intensity (PAR) and carbon dioxide (CO2). Naturally, the environment is not always optimal, and other factors such as air humidity (VPD), days of minimum temperature (Tmin), temperature (T), the temperature history (S) and soil moisture (REW) adjust and limit photosynthesis. Thus, these factors are expressed in the model as modifiers that can reduce to some degree the theoretical attainable maximum.
This is, roughly, how every factor affects photosynthesis in the model:
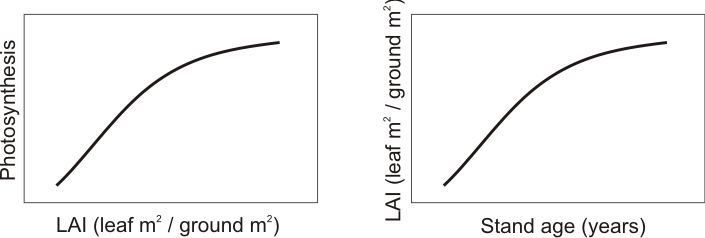
LAI stands for “Leaf Area Index” and refers to the amount of leaves in the crown of the tree. In principle, more leaves produce more photosynthesis. However, not all leaves are the same because leaves shade each other and also resources are allocated differently to leaves in different places in the crown. In consequence, bigger LAI affects less strongly to the total crown photosynthesis.
The relationship between LAI and photosynthesis can be expressed as a mathematical equation:
f(LAI)= 1 / K * (1 –e–K * LAI).
LAI = 8 m2/m2and K = 0.18 in our 50-year-old measuring site.
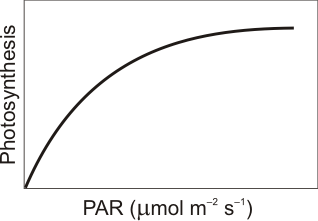
PAR stands for “Photosynthetically Active Radiation” and is a measure of light intensity. The effect of light on photosynthesis has a clear saturating pattern. At low light intensity, more light results in more photosynthesis. As the light intensity rises, the carbon fixing systems are already working at full capacity and thus the leaves can not take full advantage of all the extra light they receive.
The relationship between PAR and photosynthesis can be expressed as a mathematical equation:
f(PAR) = Pmax * PAR / (PAR + B).
Pmax= 9 µmol m–2 s–1 and B = 600 µmol m–2 s–1 at our measuring site in Hyytiälä.
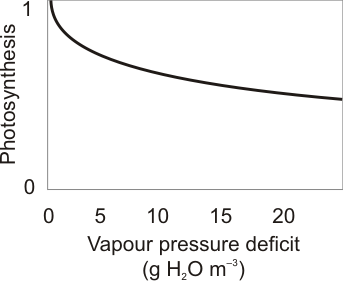
VPD stands for “Vapour Pressure Deficit” and refers to air humidity so that the higher the deficit, the drier the air. Transpiration (the flow or water from the plant to the air) increases as air becomes drier. If there would be no control on this water loss, the plant would get stressed and could even desiccate. To avoid losing too much water, the pores in the leaves (stomata) through which the water escapes close accordingly to adjust the transpiration to the level the plant can stand at every moment. Since stomata are the same pores through which the CO2 gets into the leaves, the result of this closure is a decrease also to the flow of CO2 and ultimately a reduction in photosynthesis.
The limiting effect of VPD on photosynthesis can be expressed as a mathematical equation:
f(VPD)= e–H*VPD.
H = 0.02 at our measuring site in Hyytiälä.
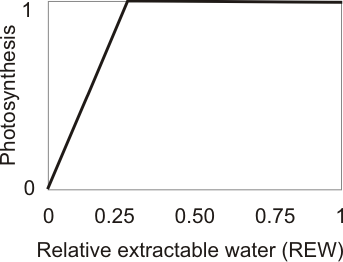
REW stands for “Relative Extractable Water” and it refers to the amount of soil water available to the plant. When the soil water decreases it gets increasingly difficult for the roots to provide water to the plant and compensate for the simultaneous loss of water from the leaves. In order to decrease this demand, a similar effect as that of high VPD is produced: stomatal pores close and CO2 flow and photosynthesis decrease.
The limiting effect of REW on photosynthesis can be expressed as a mathematical equation:
if REW≥REWCRIT ,f(REW) = 1,
if REW<REWCRIT , f(REW ) = Max { 0 , REW / REWCRIT }.
REWCRIT = 0.45 at our measuring site in Hyytiälä.
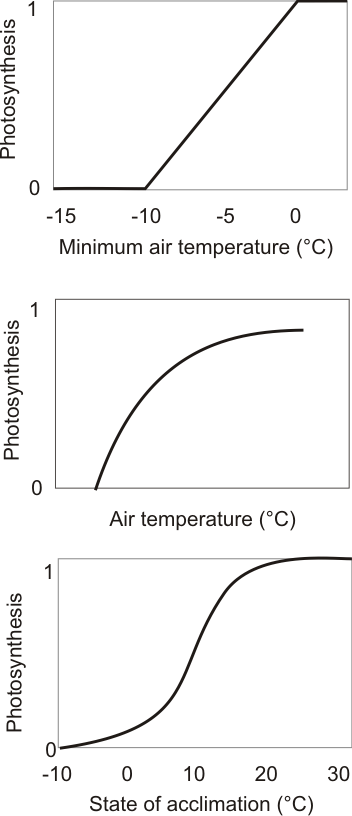
The effect of the air temperature on photosynthesis is expressed as a combination of three limiting effects. It takes into account the current temperature (T), minimum temperature and temperature history, S. If temperature during the past 24 h (Tmin)is below 0°C, photosynthesis decreases and if temperature has been below -10°C, photosynthesis shuts down. Mathematically, it can be expressed as follows:
f(Tmin) = Max { 0 , Min { 1, (T0min – Tmin ) / T0min } }.
T0min = –10 °C at our measuring site in Hyytiälä.
The readiness of the plant to carry out photosynthesis is different at different times of the year (maximum in summer, minimum in winter etc) and this process is regulated largely by the air temperature. S stands for “Stage of acclimation” and refers to this seasonality of the photosynthetic activity. The stage of acclimation at any given day depends on the temperatures experienced by the plant during the previous days. It reflects the ability of the plant to follow the advancement of the seasons and synchronize the biological activity accordingly, usually with a strategy of minimizing the risks (e.g. frost damage). S at time t follows the air temperature at time t with a time constant, τ, that is usually 150 h. It can be calculated as a time derivative:
dS/dt = ( T(t) – S(t) ) / τ .
The effect of S on photosynthesis can be expressed mathematically as follows:
f(S) = 1 / (1 + ec*(S–TS) ).
c = –0.25 and TS = 5.5°C at our measuring site in Hyytiälä.
The effect of current air temperature (T) og photosynthesis can be expressed mathematically as follows:
f(T)=1–ecT*(T–T0).
T0 = –5 °C and cT = Min {-0.1, 0.5 * ( f(S)–1) } at our measuring site in Hyytiälä.
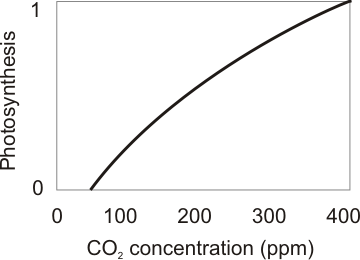
In general, the more carbon dioxide that is available to the plant, the faster the rate of photosynthesis. The relationship between CO2 concentration and photosynthesis can be expressed by a mathematical equation:
f(CO2)=(CO2 – γ) / (CO2 + γ + KCO2) * (CO2ref + γ + KCO2 ) / (CO2ref – γ).
CO2ref=400 ppm, γ=50 ppm and KCO2=500 ppm at our measuring site in Hyytiälä.
For a description on a similar model you can consult:
Mäkelä, A., Pulkkinen, M., Kolari, P., Lagergren, F., Berbigier, P., Lindroth, A., Loustau, D., Nikinmaa, E., Vesala, T., and Hari, P. 2008. Developing an empirical model of stand GPP with the LUE approach: analysis of eddy covariance data at five contrasting conifer sites in Europe. Global Change Biology, 14, 92-108.